

Debunking Virus Denial

Some people believe Sars-Cov-2 does not exist and claim it has never been isolated despite overwhelming evidence that it does exist and has been isolated and purified (albeit not in ways deemed acceptable to them because of the use of culture and presence of extracellular debris).
I shamefully confess I briefly went down that rabbit hole early in the COVID plandemic following Jon Rappaport. Fortunately I pulled myself out when I realized its not that the virus does not exist, but that virologists, public health officials and vaccinologists tend to overstate the severity of the diseases they cause.
For example COVID can be a serious disease for the elderly who are frail or for some younger people who have serious and/ or multiple morbidities, but not for most people.
They say there is no evidence anyone is dying from an infectious virus. They claim Terrain Theory is true while Germ Theory is a hoax
I believe the pathogenesis of Sars-Cov-2 in COVID-19 disease involves both germ theory and terrain theory, not just one or the other. “SARS-CoV-2 infection is an insufficient but necessary factor in the pathogenesis of COVID-19,”.
Those with a weak terrain such as the elderly and those with morbidities who are immune deficient or have dysregulated immune responses may suffer once infected without adequate treatment. Unfortunately treatment has been withheld (Ivermectin,HCQ, Zinc, antibiotics, high dose steroids, Vitamin C/D, etc) and other treatments which are harmful (Remdesivir, Ventilators, Midazolam)
Based on my research the collective evidence for a virus is clear. While any given piece may not be conclusive on its own, collectively it is convincing
I will start with some basic facts before going into the weeds on the science. In order of no importance
1.Those with more severe symptoms tend to have higher viral load as determined by PCR than those with mild symptoms/asymptomatic, although there are some conflicting studies
https://www.cebm.net/covid-19/sars-cov-2-viral-load-and-the-severity-of-covid-19/
Also viral load as determined by PCR do decrease over time as disease symptoms resolve
https://pubmed.ncbi.nlm.nih.gov/33521734/
2.Purified spike protein and isolated Sars-Cov-2 (includes cellular debris) are commercially available.

https://www.beiresources.org/ProductInformationSheet/tabid/784/Default.aspx?doc=78082.pdf

3.Next Generation Sequencing (NGS) of Whole Genomes does not require purified virus samples as the clinical samples are lysed destroying all lipids/proteins leaving only genetic material, and algorithms distinguish between human and other viral/bacterial and Sars-Cov-2 genetic material
Millions of clinical samples taken from PCR positive patients have been sequenced from patients who tested positive and the vast majority if not all find Sars-Cov-2 after whole genome sequencing
5.From the Sars-Cov-2 sequences one can estimate the number of amino acids that should be in the virus, and amino acid analysis is used to verify these proteins in isolates from humans
https://www.ncbi.nlm.nih.gov/pmc/articles/PMC7309413/
https://pcl.tamu.edu/amino-acid-analysis/
6.Those who have moderate COVID symptoms and test positive for COVID develop antibodies to the virus. Serology is old and proven science
7.Animals infected with viral isolates (not purified as you would like) that are obtained from humans who test positive for COVID via PCR , get sick and develop antibodies
https://medicalxpress.com/news/2021-01-results-comprehensive-sars-cov-animal-published.html
8.Epidemiological evidence is convincing that those with COVID symptoms who test positive via PCR transmit to close naive contacts who then develop symptoms and/or test positive
https://pubmed.ncbi.nlm.nih.gov/33315116/
9.Spike protein in urine of patients who test positive for Sars-Cov-2 and have Covid symptoms
https://kidney360.asnjournals.org/content/2/6/924
10.We have pictures

11.Flu is seasonal but PCR testing is finding positives in patients with COVID year round (not seasonal) so its not all flu cases being labelled as COVID as some allege
12.There is clearly excess mortality even if that may be overstated as some being with Covid but not dying of Covid. Indeed excess deaths for all causes is approaching 1.1 million for 2020-2021 in the US
While some of the excess deaths. can be attributed to lockdowns or the vaccine, in April,2020 the spike in deaths in UK and US could not all have been due to the recently imposed lockdowns (just beginning) or flu (flu season is usually waning in April).
And it wasn’t only in nursing homes as these only accounted for 40% of the early COVID deaths
Certainly inadequate/improper treatment of those dx with Covid was responsible for a high mortality rate(overuse of respirators, use of midazolam which suppresses respiration, and withholding of steroids, and by May the use of Remdesivir (which proved toxic in Ebola trials) which contributed to more deaths
13 CDC Timeline:
On January 20, 2020, CDC received a clinical specimen collected from the first reported U.S. patient infected with SARS-CoV-2. CDC immediately placed the specimen into cell culture to grow a sufficient amount of virus for study.
On February 2, 2020, CDC generated enough SARS-CoV-2 grown in cell culture to distribute to medical and scientific researchers.
On February 4, 2020, CDC shipped SARS-CoV-2 to the BEI Resources Repository.
Their procedure is here.
https://wwwnc.cdc.gov/eid/article/26/6/pdfs/20-0516.pdf
Based on this CDC then developed the first FDA EUA RT-qPCR test in February/March (which they withdrew support of and rescinded EUA in December 2021 due to the multitude of other commercially available EUA - PCR tests)
https://www.fda.gov/media/134922/download
This paper from
1996, shows virus identification is more complicated than we think.
https://www.ncbi.nlm.nih.gov/pmc/articles/PMC172879/pdf/090018.pdf
Kochs postulates were developed for much larger bacteria at a time viruses were unknown. The most revolutionary advance in biomedical science since the time of Koch is the discovery of nucleic acids as the source of genetic information and as the basis for precise characterization of an organism. The ability to detect and manipulate these nucleic acid molecules in microorganisms has created a powerful means for identifying previously unknown microbial pathogens and for studying the host-parasite rela- tionship.
Koch’s postulates can be summarized from his presentation before the Tenth International Congress of Medicine in Berlin in 1890
(i) The parasite occurs in every case of the disease in question and under circumstances which can account for the patho- logical changes and clinical course of the disease.
(ii) The parasite occurs in no other disease as a fortuitous and nonpathogenic parasite.
(iii) After being fully isolated from the body and repeatedly grown in pure culture, the parasite can induce the disease anew.
If these three conditions were satisfied, Koch stated , ‘‘the occurrence of the parasite in the disease can no longer be accidental, but in this case no other relation between it and the disease except that the parasite is the cause of the disease can be considered.’’
Some reviewers have added a fourth postulate consisting of a requirement to reisolate the microbe from the experimentally inoculated host. Although logically consistent with Koch’s other conditions, this fourth condition appears not to have been emphasized or required by Koch.
However, even Koch was aware of the limitations imposed by these postulates. He believed that cholera and leprosy were caused by specific visible microbes, but he could not fulfill all of the postulates for disease causation.
Although Vibrio cholerae was isolated from patients with cholera in the time of Koch, it was also isolated from healthy subjects, thereby defying the specificity of asso- ciation demanded by Koch’s second postulate.
Scientists have been no more successful today than a century ago in culturing the etiologic agent of leprosy, Mycobacterium leprae. The inability to isolate M. leprae in pure culture prevents the fulfillment of Koch’s third postulate. Nonetheless, Koch stated:
‘‘Therefore, we are justified in stating that if only the first two conditions of the rules of proof are fulfilled, i.e., if the regular and exclusive occurrence of the parasite is demon- strated, the causal relationship between parasite and disease is validly established.’’
The limitations of Koch’s postulates, evident in the 1800s,
are even more pronounced today. Organisms such as Plasmodium falciparum and herpes simplex virus or other viruses cannot be grown alone, i.e., in cell-free culture, and hence cannot fulfill Koch’s postulates, yet they are unequivocally pathogenic.
Similarly, certain microbes such as human immunodeficiency virus (HIV) exhibit a host range that is restricted to humans; they cannot produce typical disease in other hosts, thereby making impossible or unethical the final fulfillment of the third postulate.
Furthermore, how does one meet criteria for causation when a pathogenic microbe is also capable of a carrier state (e.g., Neisseria meningitidis), causing disease in one individual and not in another?
In contrast to the beliefs of Koch and those of his era, we are well aware today that microbial pathogens often cause subclinical infection. For example, the vast majority of patients exposed to M. tuberculosis will simply develop a silent infection accompanied by microscopic forms of pathology, marked by the presence of a positive tuberculin skin test, and will not go on to develop active disease.
The presence of tubercle bacilli in healthy subjects or subjects with an unrelated disease would seem to violate Koch’s second postulate.
Since viruses propagate by usurping cellular machinery, they cannot be propagated in pure (lifeless or cell free) culture and there- fore cannot fulfill Koch’s postulates.
The dogmatic insistence that viruses fulfill traditional Koch’s postulates probably impeded the early understanding of viral pathogenesis, as observed by the virologist Thomas Rivers in his Presidential Address before the Society of American Bacteriologists in 1936.
He stated , ‘‘It is unfortunate that so many workers blindly followed the rules, because Koch himself quickly realized that in certain instances all the conditions could not be met. . . . Thus, in regard to certain diseases, particularly those caused by viruses, the blind adherence to Koch’s postulates may act as a hindrance instead of an aid.’’
Rivers proposed his own postulates to establish a causal relationship between a virus and a disease : (i) a specific virus must be found associated with a disease with a degree of regularity; and (ii) the virus must be shown to occur in the sick individual not as an incidental or accidental finding but as the cause of the disease under investigation.
Rivers’ postulates differed from Koch’s postulates in that the pathogenic virus did not need to be present in every case of the disease, the possibility of a viral carrier state was recognized, and the requirement for propagation of the pathogenic virus in media or cell culture was abandoned. Rivers proposed several approaches to fulfilling the second postulate, which distinguished between causation and simple association.
The pathogenic virus should be present at the proper time in specific lesions. Disease should be produced with some regularity by serial inoculation of infected material (tissue, blood, or exu- date) ‘‘free from ordinary microbes or rickettsiae’’ into suscep- tible hosts, incorporating appropriate controls .
The production of specific antibodies in response to a viral infection provides further evidence of a pathogenic role, especially in concert with other evidence. Rivers recognized multiple potential pitfalls, including the difficulty of determining the presence of a virus in a tissue sample for animal inoculation and the potential for coinfection with other nonpathogenic viruses or viruses persisting in a carrier state, leading to misinterpretation of animal experiments. Nevertheless, Rivers’ challenge to the classical Koch’s postulates provided a new way of thinking about disease causation.
In his review ‘‘Causation and Disease’’ , Evans documented the evolution of thought on causal theory in medicine following the enunciation of Robert Koch’s postulates. Evans developed a set of criteria for causation based on modern technology, improved understanding of pathogenesis, and an appreciation of the limitations of the original Koch’s postulates.
This unified concept of causation was intended to apply to acute and chronic diseases with diverse etiologies.
(i) Prevalence of the disease should be significantly higher in those exposed to the putative cause than in control cases not so exposed.
(ii) Exposure to the putative cause should be present more commonly in those with the disease than in controls without the disease when all risk factors are held constant.
(iii) Incidence of the disease should be significantly higher in those exposed to the putative cause than in those not exposed, as shown in prospective studies.
iv) Temporally, the disease should follow exposure to the putative agent with a distribution of incubation periods on a bell-shaped curve.
(v) A spectrum of host responses should follow exposure to the putative agent along a logical biologic gradient from mild to severe.
(vi) A measurable host response following exposure to the putative cause should regularly appear in those lacking this before exposure or should increase in magnitude if present before exposure.
(vii) Experimental reproduction of the disease should occur in higher incidence in animals or humans appropriately exposed to the putative cause than in those not so exposed; this exposure may be deliberate in volunteers, experimentally induced in the laboratory, or demonstrated in a controlled regulation of natural exposure.
(viii) Elimination or modification of the putative cause or of the vector carrying it should decrease the incidence of the disease (e.g., control of polluted water or smoke).
(ix) Prevention or modification of the host’s response on exposure to the putative cause should decrease or eliminate the disease (e.g., immunization or drug).
(x) The whole thing should make biologic and epidemiologic sense.
Now lets try to look at the Science, and I admit its a difficult task since virologists seem to have developed their own language and don’t dumb it down for the rest of us
Identifying the virus. Unfortunately, this gets a little bit in the weeds. There is no other way. Viruses are nanoparticle who like to hide out in cells and only replicate there. Isolation and identification is a bitch. Its not like most bacteria which are much larger and grow without any other living material
-For this what we are most interested in is “Diagnostic virology” whichis concerned with identifying the virus associated with clinical signs and symptoms. Procedures most commonly used include:
1. Detection of a meaningful immune response to the virus (antibody or cell-mediated) by immunologic assay(s)
2. Identification of the agent by staining of specimens or sections of tissue and microscopy
3. Isolation and identification of the agent (cell culture or fertile eggs)
4. Detection of viral nucleic acid (probes or amplification).
5.Genomic and protein sequencing
As mentioned ,unlike bacteria, many of which can be grown on an artificial nutrient medium, viruses require a living host cell for replication.
Infected host cells (eukaryotic or prokaryotic) can be cultured and grown, and then the growth medium can be harvested as a source of virus.
Virions in the liquid medium can be separated from the host cells by either centrifugation or filtration.
Filters can physically remove anything present in the solution that is larger than the virions; the viruses can then be collected in the filtrate
Using either the serum from patients infected with a specific virus, virus passaged in eggs or viruses grown in cell culture one is massively increasing the proportion of that virus to any contaminants.
It is not easy to grow viruses in cell culture. Therefore when conditions are found for one virus they are unlikely to be optimal for other (low-level) contaminants. Thus the actual passage in culture reduce the concentration of viral contaminants.
The purification problem becomes one of separation from cell debris.
Several problems exist with this technology. One is that the success of isolation is dependent on a viable virus particle. Often, when trying to identify a virus as the source of a disease, the virus is no longer in the process of reproducing itself and is not producing infectious offspring.
For example in an infected host Sars-Cov-2 typically stops replicating after 7-8 days. The disease after this period is due to inflammation from the viral and cellular debris.
This method is also highly dependent on optimal collection and sample handling, as many viruses are not very stable outside of the host system.
Another problem is the availability of suitable systems, such as the right cell line to be able to grow the suspected virus. There are many viruses yet to be identified because we don’t know how to culture them
Various types of cells can be used to support the growth of viruses. A primary cell culture is freshly prepared from animal organs or tissues. Cells are extracted from tissues by mechanical scraping or mincing to release cells or by an enzymatic method using trypsin or collagenase to break up tissue and release single cells into suspension.
Because of anchorage-dependence requirements, primary cell cultures require a liquid culture medium in a Petri dish or tissue-culture flask so cells have a solid surface such as glass or plastic for attachment and growth.
Primary cultures usually have a limited life span. When cells in a primary culture undergo mitosis and a sufficient density of cells is produced, cells come in contact with other cells. When this cell-to-cell-contact occurs, mitosis is triggered to stop. This is called contact inhibition and it prevents the density of the cells from becoming too high.
To prevent contact inhibition, cells from the primary cell culture must be transferred to another vessel with fresh growth medium. This is called a secondary cell culture. Periodically, cell density must be reduced by pouring off some cells and adding fresh medium to provide space and nutrients to maintain cell growth.
In contrast to primary cell cultures, continuous cell lines, usually derived from transformed cells or tumors, are often able to be subcultured many times or even grown indefinitely (in which case they are called immortal).
Continuous cell lines may not exhibit anchorage dependency(they will grow in suspension) and may have lost their contact inhibition. As a result, continuous cell lines can grow in piles or lumps resembling small tumor growths (see Figure 4).

Figure 4. Cells for culture are prepared by separating them from their tissue matrix. (a) Primary cell cultures grow attached to the surface of the culture container. Contact inhibition slows the growth of the cells once they become too dense and begin touching each other. At this point, growth can only be sustained by making a secondary culture. (b) Continuous cell cultures are not affected by contact inhibition. They continue to grow regardless of cell density. (credit “micrographs”: modification of work by Centers for Disease Control and Prevention)
Filters can physically remove anything present in the solution that is larger than the virions; the viruses can then be collected in the filtrate (see Figure 1).

Figure 1. Membrane filters can be used to remove cells or viruses from a solution. (a) This scanning electron micrograph shows rod-shaped bacterial cells captured on the surface of a membrane filter. Note differences in the comparative size of the membrane pores and bacteria. Viruses will pass through this filter. (b) The size of the pores in the filter determines what is captured on the surface of the filter (animal [red] and bacteria [blue]) and removed from liquid passing through. Note the viruses (green) pass through the finer filter. (credit a: modification of work by U.S. Department of Energy)
Virus isolation is often a very slow and labor intensive process, thus alternative tests are constantly being developed.
Purification
When extracting virus genome using the classical method, the virus particles must first be purified. Then the virus genome extracted from the particles is examined.
Moreover, while studying new viruses, purification with an ultracentrifuge becomes a necessity.
While purifying virus in samples obtained from patients, they must separate cell organelles, biological macromolecules, and the like from the virus. This is achievable since these particles have a variety of sizes and densities.
The purification of viruses by ultracentrifugation utilizes density gaps into which other particles do not come to rest by using a combination of “sucrose density gradient centrifugation, which is affected by the S value of particles” and “cesium chloride density gradient equilibrium centrifugation (density equilibrium ultracentrifugation), which is affected by the buoyant density of particles in a solvent.”
Viruses are complexes of proteins (mostly with a buoyant density of 1.3 g/cm3) and nucleic acids (mostly with a buoyant density of 1.7 g/cm3), so the buoyant density ranges from 1.35–1.4 g/cm3.
Thus, separation is performed using density gradient centrifugation of sucrose, cesium chloride, and the like.
Virus fractions have a higher density than microsome fractions because they include nucleic acids..
Ultracentrifugation involves purification by combining these two parameters, so it is apparent that it is closely tied to physicochemical properties.
The centrifuge is also extremely important to discern these physiochemical properties. Size can also be reliably ascertained with an electron microscope, but if a new strain of virus is present, it is challenging to know where the virus will come to rest when centrifuged .
Chromotography
Another method of purification is Chromatography.
Chromatographyis a laboratory techniquefor the separationof a mixtureinto its components. The mixture is dissolved in a fluid solvent (gas or liquid) called the mobile phase, which carries it through a system (a column, a capillary tube, a plate, or a sheet) on which a material called the stationary phaseis fixed.
Because the different constituents of the mixture tend to have different affinities for the stationary phase and are retained for different lengths of time depending on their interactions with its surface sites, the constituents travel at different apparent velocities in the mobile fluid, causing them to separate
The columns pore size has an impact on how much of the virus is removed in chromatography and so does the kind of resin, protein solution, and buffer. It is also more difficult to remove smaller viruses fully with this method.
Some columns use calcium phosphate, usually at pH7. Elution rates can be changed by altering the pH level and impacting the phosphate concentration.
An example of a virus that can be treated with this method is the influenza virus. Purity can be improved by 30 to 100 fold. Further improvement can be made by employing an additional chromatography column which can improve the concentration by 10 to 30 fold.

https://www.news-medical.net/life-sciences/Virus-Purification-Methods.aspx
Virus purification-chromotography
https://www.nature.com/articles/3302611
Analyzing the Virus
After purification to isolate the contents of a virus, scientists must dismantle the viruses into their constituent molecular parts. They may do this by adding a special detergent, such as SDS, to a viral isolate.
The isolate will then consist of the individual molecules that compose the viruses. These molecules include proteins that decorate and line the outer membrane envelope, the globs that form the hollow inner core, and the contents of the inner core: enzymes and DNA or RNA.
Scientists can separate these molecular species from each other, using electrophoresis,, whereby an electric field pulls the molecules through a gel so that they band according to their weights(instead of densities).
Some of the bands will contain proteins, and others contain genetic material, either RNA or DNA.
The emerging techniques included gel electrophoresis of proteins(to determine their size and relative abundance, and to effect small-scale preparations).
Larger scale purification of the virus proteins was possible with purified preparations, allowing amino acid sequencing, especially of the most abundant proteins (e.g. the nucleocapsid protein, N), and cDNA cloning and sequencing technology led to the sequencing of the whole Edmonston virus genome by Bellini et al.in 1985.
This latter resulted in a much greater understanding of the gene expression of the virus, and provided tools such as specific oligonucleotide probes for various genes and antibody reagents to detect specific proteins.
Scientists call an electrophoresed sample a Western blotif they are considering the bands that contain proteins, a Southern blotif they are considering the bands that contain DNA, and a Northern blotif they are considering the bands that contain RNA. (The unusual names are a salute to E. M. Southern, the scientist who devised this process.)

Protein bands and their constituent molecules are named according to the weight (in daltons) of the molecules. The prefix "p" stands for protein, and "gp" stands for glyco-protein(glycomeaning that the protein has some sugar molecules stuck to it).
RNA and DNA bands are named according to the number of nucleic acids or base pairs (in kilobases) that make up the constituent RNA or DNA molecules.

Electron Microscopy
Another way to identify a virus is with the use of the electron microscope. Since viruses are much smaller than bacteria, a regular light microscope does not provide sufficient magnification to see them. The magnification of an electron microscope (50,000x magnified) provides the ability to see the viral particles.
The problem with this method is the lack of sensitivity: a concentration of approximately 1,000,000 virus particles per milliliter of fluid is required in order to see the virus of interest.

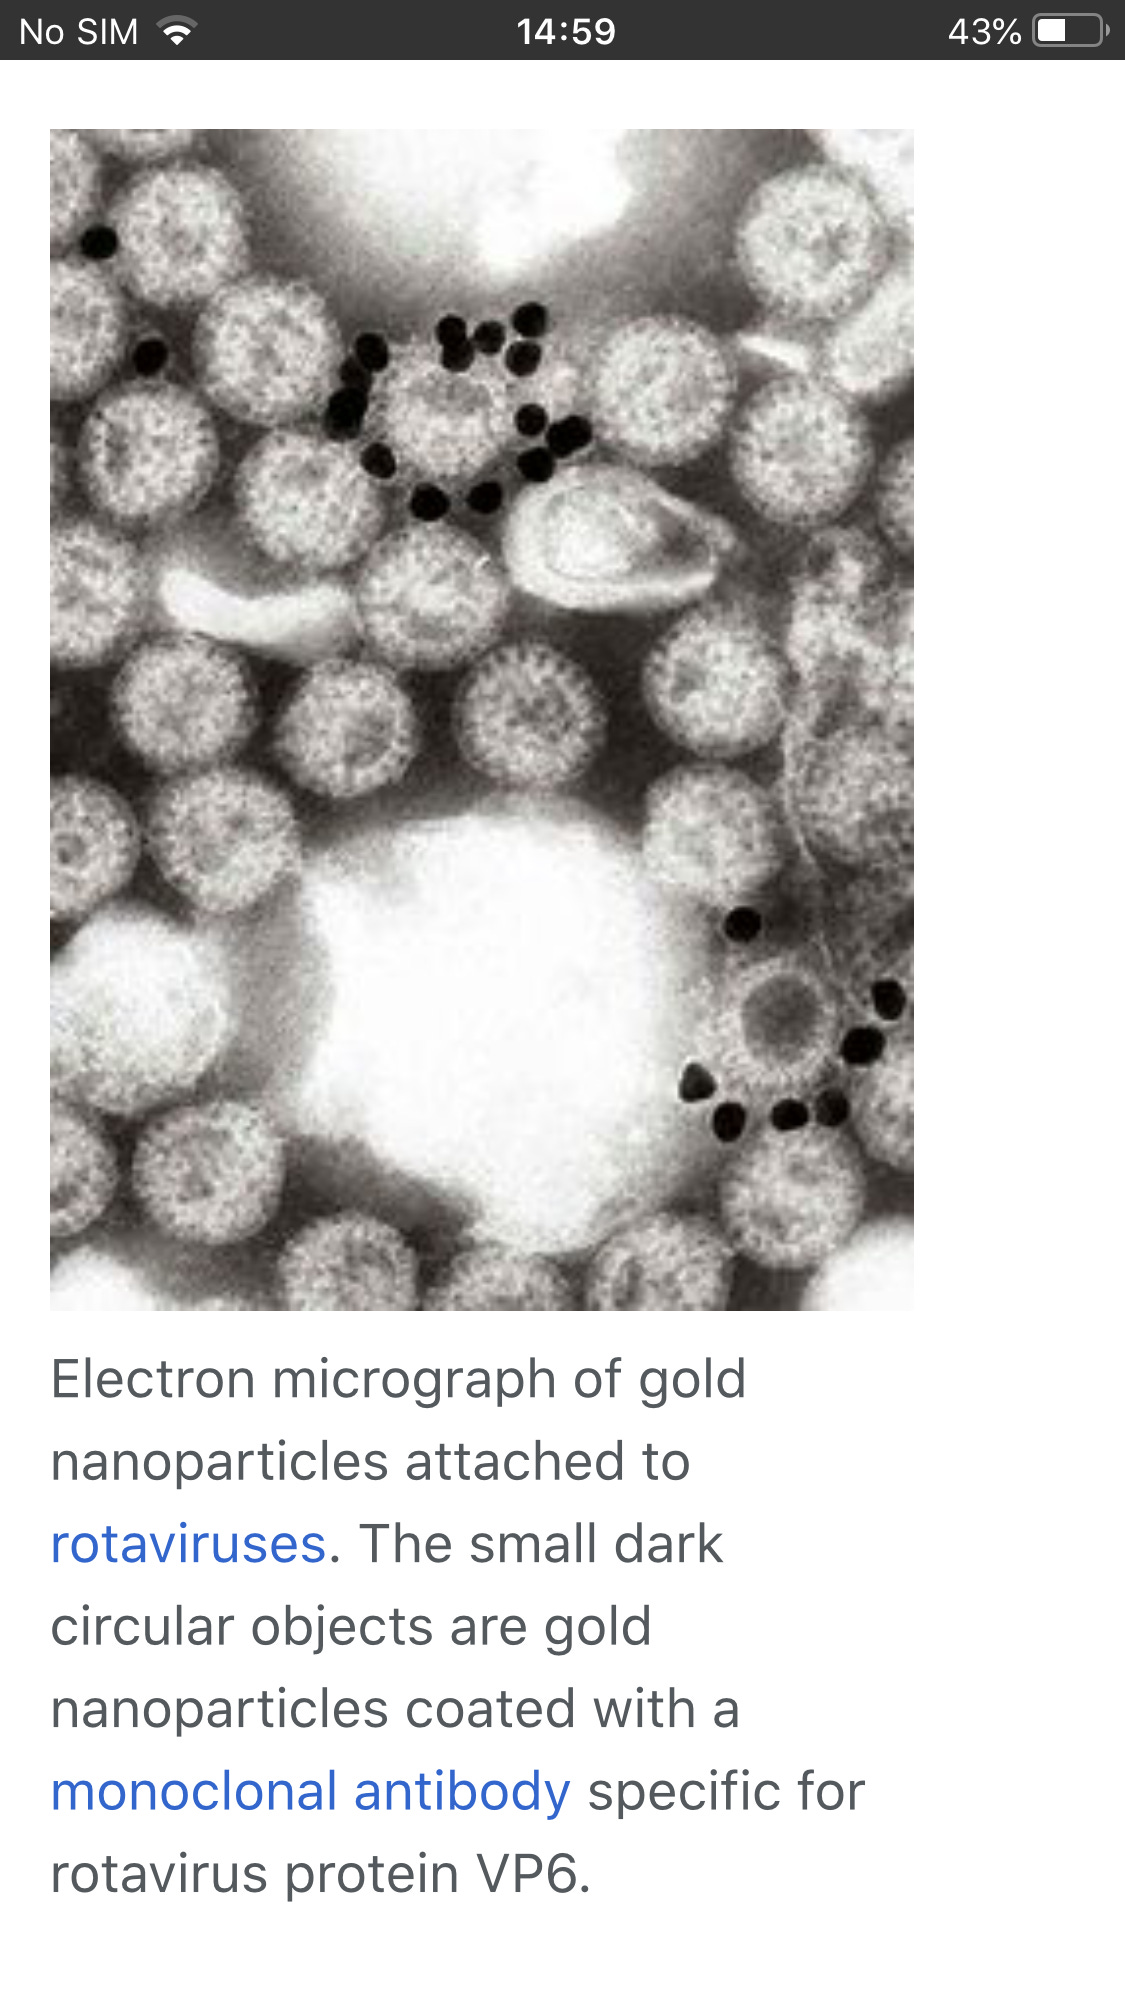
However techniques can be used to improve this, such as immune electron microscopy. One such method is solid phase immune electron microscopy. With this technique antibody against the virus of interest is coated on the electron microscope grid before the virus suspension is to capture virus particles onto the EM grid
Another method is to suspend Viruses , usually in phosphate buffered saline, and add antibodies. The mixture is warmed, usually to 37 °C, centrifuged at 10,000gfor a few minutes and the resultant pellet examined by negative stainelectron microscopy. Any aggregated virus particles can be identified if the specificity of the antisera is known.
Detection of Immune Response
One measure of the immune system's response to a substantial viral infection is the production by B-cells of proteins called antibodies. Antibodies latch onto and neutralize other proteins.
Proteins that elicit an immune response are called antigens. Viral antigens tend to be those proteins that compose the inner core, and those that decorate or line the outer membrane envelope.
These are the proteins that the immune system "sees," whereas proteins inside the core—the viral enzymes—are shielded from immune surveillance.
Often, it is difficult to identify a virus in relation to the disease observed, or when conducting a retrospective study of a population to determine exposure to a virus, or when measuring the response of an individual to a vaccine.
In these cases, indirect methods of measure are needed, such as measuring antibody response to the virus of interest. Several methods exist for this purpose. A few of the most commonly used methods include:
• Virus neutralization (VN)
• Hemagglutination inhibition (HI)
• Enzyme linked immunosorbent assay (ELISA)
• Indirect fluorescent antibody (IFA)
• Complement fixation (CF)
• Agar-gel immunodiffusion (AGID)
• Agar-gel precipitin (AGP)
• Latex agglutination (LA).
The principles of these assays are fundamentally the same, they depend upon antibody-antigen interactions and consist of a known virus or viral protein, a patient sample (usually serum), and an indicator.
If antibodies are present in the patient’s serum, they will bind to the virus. If no antibodies are present, no binding will occur. The indicator is observed to determine whether the sample is positive or negative for antibodies.

I wont cover all methods but lets look at a couple
Virus Neutralization
In the virus neutralization (VN) test, the sample of interest is incubated with the target virus and changes in cell culture are observed (called cytopathic effect, CPE). If the sample contains antibodies, it will prevent the virus from growing in the cell culture and no CPE will be observed. If no antibodies are present in the sample, the virus will grow and CPE will be observed.
Cytopathic effects (CPEs)are a key piece of evidence a virus is present. There are distinct observable cell abnormalities due to viral infection of a cell. CPEs can include loss of cell adherence to the surface of the container, changes in cell shape from flat to round, shrinkage of the nucleus, vacuoles in the cytoplasm, fusion of cytoplasmic membranes and the formation of multinucleated syncytia, inclusion bodies in the nucleus or cytoplasm, and complete cell lysis (see Table 1).
Further pathological changes include viral disruption of the host genome and altering normal cells into transformed cells, which are the types of cells associated with carcinomas and sarcomas. The type or severity of the CPE depends on the type of virus involved. Table 1 lists CPEs for specific viruse

This is usually observed when the virus is cultured. Some of the Virus Deniers Claim this cytopathic effect is due to chemicals added to the culture and not the virus which is in the isolate added to the culture. However, they ignore the fact that there is s control where these same same chemicals are added to cells but without the isolate. If cells grow without cytopathic effect in the control but cytopathic effect is observed in the culture that added the isolate this is evidence the isolate contained a virus
Hemagglutination Inhibition
Certain viruses have a protein on their surface that interacts with red blood cells and is able to attach to them. This property is called hemagglutination and the surface protein of the virus is hemagglutinin.
The inhibition or blocking of this activity is the basis of the hemagglutination inhibition (HI) test. The most well known virus with this property is the influenza virus.
Like the virus neutralization (VN) test, the patient’s serum sample is incubated with the virus of interest but instead of growing the virus in cells, red blood cells are added to the virus-serum mix. If antibodies are present, the hemagglutination activity will be blocked; if no antibodies are present the virus will agglutinate (bind together). In this case the red blood cells are the indicator.
Enzyme Immunoassay
Enzyme immunoassays (EIAs)rely on the ability of antibodies to detect and attach to specific biomolecules called antigens. The detecting antibody attaches to the target antigen with a high degree of specificity in what might be a complex mixture of biomolecules.
Also included in this type of assay is a colorless enzyme attached to the detecting antibody. The enzyme acts as a tag on the detecting antibody and can interact with a colorless substrate, leading to the production of a colored end product. EIAs often rely on layers of antibodies to capture and react with antigens, all of which are attached to a membrane filter (see Figure 7).
EIAs for viral antigens are often used as preliminary screening tests. If the results are positive, further confirmation will require tests with even greater sensitivity, such as a western blotor an NAAT.

Figure 7. Similar to rapid, over-the-counter pregnancy tests, EIAs for viral antigens require a few drops of diluted patient serum or plasma applied to a membrane filter. The membrane filter has been previously modified and embedded with antibody to viral antigen and internal controls. Antibody conjugate is added to the filter, with the targeted antibody attached to the antigen (in the case of a positive test). Excess conjugate is washed off the filter. Substrate is added to activate the enzyme-mediated reaction to reveal the color change of a positive test. (credit: modification of work by “Cavitri”/Wikimedia Commons)
The enzyme-linked immunosorbent assay ELISA is a very popular technique due to the ease of use and low cost.
The ELISA consists of plastic wells coated with either the antigen (virus) of interest or a protein spe- cific to the antigen (virus) of interest.
The unknown sample (serum) is allowed to bind to the coated well, an antibody labeled with an enzyme is applied, an indicator is added, and then a color change is observed.
The presence of color indicates the presence of antibodies and the absence of color indicates the absence of antibodies.

Protein Sequencing
The first major technology to emerge for the identification of proteins was the sequencing of proteins by Edman degradation.A major breakthrough was the development of microsequencing techniques for electroblotted proteins .
One of the most important developments in protein identification has been the development of MS technology. In the last decade, the sensitivity of analysis and accuracy of results for protein identification by MS have increased by several orders of magnitude .
It is now estimated that proteins in the femtomolar range can be identified in gels. Because MS is more sensitive, can tolerate protein mixtures, and is amenable to high-throughput operations, it has essentially replaced Edman sequencing as the protein identification tool of choice.
The growth of proteomics is a direct result of advances made in large-scale nucleotide sequencing of expressed sequence tags and genomic DNA. Without this information, proteins could not be identified even with the improvements made in MS. (genomic sequencing covered below)
Protein identification (by MS or Edman sequencing) relies on the presence of some form of genomic database for the given organism
The majority of DNA and protein sequence information has accumulated within the last 5 to 10 years

Protein Structure
Cryo-EM allows movies to be taken of the spike protein

And x-Ray crystallography provide us with an electron density map revealing structure
Too deep into the weeds for me though

Molecular Methods
This is the most difficult part to understand, but is important.

The area undergoing the most growth is in molecular methods and techniques, particularly in relation to virology. Molecular methods do not rely on the presence of a live virus like virus isolation procedures. These methods detect a piece of the viral genome, making them more sensitive for the detection of viruses.
Molecular techniques are similar across disciplines thus techniques used in the study of viruses are similar to those used in other areas of microbiology such as bacteriology (bacteria) and mycology
Nucleic Acid Amplification Test
Nucleic acid amplification tests (NAAT)are used in molecular biology to detect unique nucleic acid sequences of viruses in patient samples.
Polymerase chain reaction (PCR)is an NAAT used to detect the presence of viral DNA in a patient’s tissue or body fluid sample. PCR is a technique that amplifies (i.e., synthesizes many copies) of a viral DNA segment of interest. Using PCR, short nucleotide sequences called primers bind to specific sequences of viral DNA, enabling identification of the virus.
Before performing PCR or any other in vitro manipulation of DNA, it is necessary to purify DNA from an organism. This involves lysing cells and removing proteins, lipids, carbohydrates, salts and other contaminating materials to obtain a solution of pure DNA.
PCR is in some ways even more powerful than DNA replication in cells because we have the capability of specifying the exact DNA segment that we want to copy and we can carry out multiple rounds of replication very rapidly to obtain billions of copies of the replicated fragment in a few hours.
To perform PCR, a DNA template sample , free DNA nucleotides, a DNA polymerase, a specific "forward" DNA primer, and a specific "reverse" DNA primer are combined in a tube with an appropriate buffer.
The two DNA primers are complementary to opposite strands of the DNA fragment that will be copied. One primer can prime DNA replication in one direction, and the other primer primes DNA replication in the opposite direction on the other strand .
Several companies synthesize DNA primers with custom sequences for researchers.
Since PCR has required fairly high temperatures, including 95°C for the denaturation step, you may be wondering how DNA polymerase could still be active since it should have been denatured by the high temperature.
The answer is that most DNA polymerases would be denatured at these temperatures. The trick to PCR is using a DNA polymerase from a species that normally lives at high temperatures and has evolved a DNA polymerase that can withstand high temperatures without denaturing.
The most commonly used DNA polymerase for PCR was isolated from the bacterium Thermus aquaticus, which lives in hot springs. This enzyme, called Taq polymerase (pronounced "tack") does not denature at 95°C and is therefore still active in a PCR reaction.
Note that template DNA is more likely to anneal to a primer than back to the original complementary strand of DNA because primers are present at a much higher molarity than template DNA in a PCR reaction and because primers can diffuse through the solution faster because they are much smaller than the template DNA.
Once the primers are annealed, the DNA is prepared for DNA polymerase to replicate the DNA by elongating the new strands beginning at each primer.
After the annealing step, the PCR reaction temperature is raised to 72°C, the optimal temperature for Taq polymerase to elongate the DNA strands
Researchers usually keep the reaction at 72°C for about a minute for each kilobase (1000 base pairs) of DNA they wish to copy to allow Taq polymerase time to move along the DNA.
This video from the Cold Spring Harbor DNA Learning Center shows PCR:
A typical PCR reaction is performed for about 30-35 cycles. When PCR was developed by Kary Mulis in the early 1980s (1993 Nobel Prize), a researcher would set up three water baths, one at 95°C, one at the annealing temperature, and one at 72°C and would then transfer the tubes containing the PCR reaction mix from water bath to water bath (30 seconds at 95°C, 30 seconds at the annealing temperature, a minute or so at 72°C, and then back to 95°C).
As you might imagine, it got tedious to spend hours sitting over hot water baths, watching a timer and just moving tubes around. The invention of the thermal cycler (PCR machine) solved this problem. This device contains a special heating/cooling system that is able to change the temperature of a metal block very rapidly and very precisely.
It takes only a few seconds to shift between each temperature needed in PCR, which is important not only to make the process rapid, but also to optimize the efficiency of each of the three steps. Because of the invention of the thermal cycler, a researcher could simply set up a mixture of reagents for PCR, put the reaction in the thermal cycler, and return a couple hours later to have PCR product waiting for them.
Reverse transcriptase-PCR (RT-PCR)is an NAAT used to detect the presence of RNA viruses. RT-PCR differs from PCR in that the enzyme reverse transcriptase (RT) is used to make a cDNA from the small amount of viral RNA in the specimen. The cDNA can then be amplified by PCR. Both PCR and RT-PCR are used to detect and confirm the presence of the viral nucleic acid in patient specimens.
RT-qPCR For Sars-Cov-2
COVID-19 testing uses a modified version of PCR called quantitative polymerase chain reaction (qPCR). This method adds fluorescent dyes to the PCR process to measure the amount of genetic material in a sample. In this instance, healthcare workers measure the amount of genetic material from SARS-CoV-2.
The testing process begins when healthcare workers collect samples using a nasal swab or saliva tube. The SARS-CoV-2 virus, which is the pathogen that causes COVID-19, uses RNA as its genetic material.
Whilst RNA is similar to DNA, it is sufficiently different that Taqpolymerase, the standard enzyme used for DNA amplification, replicates it only very inefficiently. Consequently, RNA is detected by a variant of the PCR test, termed reverse transcription (RT)-PCR.
Most diagnostic tests use a particular version of the RT-PCR test, termed fluorescence-based quantitative RT-PCR (RT-qPCR)
This encompasses a two-step method, typically comprising two enzymes; the first step uses a RNA-dependent DNA polymerase, also known as a reverse transcriptase, to copy RNA into DNA (cDNA), the second step then switches to the use of Taqpolymerase, which amplifies the cDNA as in a standard PCR test
The single stranded RNA is converted to double-stranded DNA during reverse transcription. The two DNA template strands are then separated by denaturation(heat)

Primers attach to the end of these strands. Primers are small pieces of DNA designed to only connect to a genetic sequence that is specific to the viral DNA, ensuring only viral DNA can be duplicated .
Center for Disease Control and Prevention(CDC)-recommended primers that specifically amplify the N1 and N2 targets of the SARS-CoV-2 nucleocapsid (N) protein. In addition, the human RNAse P gene target is also amplified as an endogenous internal control
After the primers attach, new complementary strands of DNA extend along the template strand. As this occurs, fluorescent TaqMan probes bind downstream of the primers to single-stranded cDNA
The Quencher absorbs the fluorescence due to its proximity in the probe.

At the end of the process, two identical copies of viral DNA are created. The Quencher is separated from the probe and fluorescent molecule thus gives a measurable indication (fluorescence) of successful duplication
The cycle is then repeated 20-39 times to create anywhere from 1 million to 1 trillion of DNA copies corresponding to the SARS-CoV-2 viral RNA.
When amplification starts, the level of fluorescence is low and is used to set the baseline level of fluorescence. As the reaction progresses into the exponential growth, fluorescence reaches a level which is significantly higher than the baseline; this is referred to as the threshold level.
The threshold level is the heart of quantitation, as the point at which your sample crosses this threshold is recorded as the Ct or Cq value. The threshold is set in the exponential phase, so the reading is not affected by reagent shortages, etc. in the plateau phase.
The second crucial factor in quantitation is the use of a negative control, an endogenous control present in all samples at a consistent concentration which does not change in response to biological conditions.
Once a certain level of fluorescence is detected above the threshold , which is calibrated to indicate a positive test, the number of cycles is recorded. Any number of cycles under 40 is considered as positive
(Although a positive test does not confirm replication competent virus is present, it just confirms the presence of a small piece of the virus)
Anytime that you are preforming a reaction where something is copied over and over in an exponential fashion, contaminants are just as likely to be copied as the desired input. Quantitative PCR is subject to the same contamination concerns as end-point PCR, but those concerns are magnified because the technique is so sensitive. Avoiding contamination is paramount for generating qPCR results that you can trust.
TaqMan® probes depend on Förster Resonance Energy Transfer (FRET) preventing the dye moiety from emitting a signal via the quencher when the probe is intact These probes are specific sequences which are designed to bind downstream of the qPCR primers.
The 5′ end of the probe is labelled with a fluorescent reporter such as the carboxyfluorescein (FAM) moiety; on the 3′ end is a quencher molecule which prevents fluorescent emission when in close proximity to the reporter. As DNA polymerase extends the primer, the probe is cleaved, enabling the reporter molecule to emit a fluorescent signal.
The more sensitive and reproducible method of real-time QPCR measures the fluorescence at each cycle as the amplification progresses. This allows quantification of the template to be based on the fluorescence signal during the exponential phase of amplification, before limiting reagents, accumulation of inhibitors, or inactivation of the polymerase have started to have an effect on the efficiency of amplification.
Fluorescence readings at these earlier cycles of the reaction will measure the amplified template quantity where the reaction is much more reproducible from sample to sample than at the endpoint.
In real-time QPCR, a fluorescent reporter molecule (such as a double-stranded DNA-binding dye or a dye-labeled probe) is used to monitor the progress of the amplification reaction. With each amplification cycle, the increase in fluorescence intensity is proportional to the increase in amplicon concentration, with the QPCR instrument system collecting data for each sample during each PCR cycle. The resulting plots of fluorescence vs. cycle number for all the samples are then set with their background fluorescence at a common starting point (a process known as baseline correction).
Then, a threshold level of fluorescence is set above the background but still within the linear phase of amplification for all the plots. The cycle number at which an amplification plot crosses this threshold fluorescence level is called the “Ct” or threshold cycle.
This Ct value can be directly correlated to the starting target concentration of the sample. The greater the amount of initial DNA template in the sample, the earlier the Ct value for that sample
The most direct and precise approach for analyzing quantitative data is to use a standard curve that is prepared from a dilution series of template of known concentration. This is known as “standard curve” or “absolute” quantification.
A variety of sources can be used as standard templates .The CDC test provided a positive control with the CDC 2019- nCoV Real-Time RT-PCR Diagnostic Panel procedure. The nCoVPC contained noninfectious positive control material supplied in a dried state and must be resuspended before use.
nCoVPC consists of in vitro transcribed RNA. nCoVPC will yield a positive result (Ct<40) with each assay in the 2019-nCoV Real-Time RT-PCR Diagnostic Panel including RP.

Following amplification of the standard dilution series, the standard curve can be generated by plotting the log of the initial template copy number against the Ct generated for each dilution. If the aliquotting was accurate and the efficiency of the amplification does not change over the range of template concentrations being used, the plot of these points should generate a linear regression line. This line represents the standard curve. Comparing the Ct values of the unknown samples to this standard curve would allows the quantification of initial copy numbers .

The qPCR machine measures the intensity of fluorescence emitted by the probe at each cycle. During the first cycles, there is not enough fluorescence to be detected, but the reaction rapidly produces more and more amplicons and the fluorescence builds up. A qPCR curve has typically an exponential phase followed by a plateau phase.
The Ct measure is a determined PCR cycle and represents the basic result of a qPCR experience. It’s taken in the exponential phase, where the curve is linear.
The threshold (red line) is placed in the linear phase, and the Ct is measured where the PCR curve crosses the threshold. The threshold is different for every qPCR assay (every gene tested), and is the same for all samples tested with this gene.
The principle of the qPCR is based on the fact that at each PCR cycle, the number of PCR products doubles. If there is a difference of 2 cycles between two reactions (see figure), we can say that there is 4 times more copies in the pink reaction than in the orange reaction.

However, we had to notice that they initially used tests targeting the N gene, which is known to be fairly specific. In contrast, numerous other tests are based on a wider spectrum of target sequences, which might be a reason why the sources of diagnostic uncertainty might spread far beyond possible human or instrumental errors.
Among the possible PCR targets the E gene of SARS-CoV 2 is considered to be the least specific and it shows significant sequence homology to other common coronaviruses (according to the LALIGN alignment software
In Vitro DNA Replication: DNA Sequencing (aka Sanger Sequencing)
DNA sequencing can be performed using a technique that is similar to PCR, but that also has some distinct differences. During DNA sequencing, the reaction mixture includes a DNA template (it must be purer and less complex than is required for PCR), one DNA primer (instead of two) that anneals at the beginning of the DNA segment to be sequenced, Taq polymerase, and free DNA nucleotides.
The reaction mixture is placed in a thermal cycler and the temperature is cycled the same way that it is during a PCR reaction. The two key differences in DNA sequencing compared to PCR are that DNA sequencing only uses one primer and DNA sequencing includes specially modified DNA nucleotides.
A normal PCR reaction contains a mixture of dATP, dCTP, dGTP, and dTTP (the "d" in the name indicates that these are deoxyribose or DNA nucleotides). Collectively, these are called dNTPs, where the N indicates any of the 4 bases is possible.
A sequencing reaction also includes these four nucleotides, but in addition to these deoxynucleotides, the sequencing reaction also includes small amounts of four dideoxynucleotides (ddATP, ddCTP, ddGTP, and ddTTP). The dideoxynucleotides are missing the 3' -OH group, hence the name that indicates the absence of another oxygen (Figure 3.19).

Figure 3.19: Comparison of normal deoxynucleotides and the dideoxynucleotides used in DNA sequencing. Remember that a phosphodiester bond in the DNA backbone that links nucleotides involves a reaction between the 3' -OH group of the previous nucleotide and the 5' phosphate group of the incoming nucleotide.
Therefore, a dideoxynucleotide can be incorporated into a DNA molecule because it has a 5' phosphate, but it acts as a chain terminator because the next nucleotide can't be added to it since it's missing the 3' OH (Figure 3.19).
Dideoxynucleotides are included as a small percentage of the total nucleotides in a sequencing reaction (Figure 3.20). This means that most of the time, the DNA will be copied normally with deoxynucleotides, but occasionally, DNA replication will be halted due to incorporation of a dideoxynucleotide.
Therefore, a sequencing reaction will produce products of every possible length, since dideoxynucleotides will randomly halt the replication of the DNA at a different position each time. Therefore, the products of a sequencing reaction will be millions of DNA fragments of different lengths that end at every possible nucleotide (Figure 3.20).
The final important modification in DNA sequencing is that the dideoxynucleotides are labeled. When DNA sequencing was first developed, the nucleotides were labeled with radioactive phosphorus, but today, the dideoxynucleotides are usually labeled with fluorescent dyes, a different dye color for each nucleotide (Figure 3.19).
Therefore, each DNA fragment generated in a sequencing reaction will be a unique length and will be labeled with a color that indicates the last nucleotide in the fragment (Figure 3.20).
After being removed from the thermal cycler, the sequencing reaction is denatured to separate the products from the template DNA and then run through a polyacrylamide gel. This gel separates the fragments by size and has the resolution to separate fragments that differ by as little as one nucleotide.
As the fluorescent fragments migrate through the gel past a laser detection system, a computer records the order of the fluorescent colors, and thus the sequence of the DNA(Figure 3.20).
It's important to only use one primer in a sequencing reaction so that the fragments are only produced by DNA replication in one direction.

Figure 3.20: DNA sequencing. Notice that unlike in PCR, products are not amplified exponentially in a sequencing reaction since there isn't a reverse primer that could use a product as a template. The only template is the original DNA template. This means that in order to obtain enough product to see bands on a gel, more template DNA is needed for a sequencing reaction than for PCR.
Although DNA can be directly sequenced from bacterial plasmids, the human genome is generally too complex to allow direct sequencing of its DNA since any particular target sequence will be a very small fraction of the total DNA.
In this case, PCR can be used to amplify a specific DNA fragment and then the PCR product can be used as a template in a sequencing reaction. This DNA dideoxy sequencing method can sequence about 1000 nt of DNA in one reaction. It was used to generate the first sequence of the human genome. Since there are 3.2 billion bp in the haploid human genome, each sequencing reaction only provided sequence for a very small fraction of the genome.
Millions of separate sequencing reactions were performed using small fragments of the genome as templates. In the Human Genome Project (the strategy used in the publicly-funded project is described here; Figure 3.21), human DNA was randomly cut into large fragments (100,000 - 200,000 bp each).
The large fragments were cloned into special plasmids that created bacterial artificial chromosomes (BACs). Each of the resulting 30,000 BAC clones was then randomly sheared or cut with restriction enzymes (described in Section 3.5A) and the small DNA fragments were cloned into normal bacterial plasmids. The cloned human DNA was sequenced using primers that annealed to the plasmid on either side of the inserted human DNA (in 2 separate reactions).
All of the separate DNA sequences were first assembled into the sequences that had been cloned into BACs by combining overlapping sequences into a single sequence. Then these BAC sequences were assembled into the final sequence of the human genome by combining the sequences of overlapping BACs into one very long single sequence for each human chromosome. The Human Genome Project took about 15 years to complete.
NGS (Next Generation Sequencing)
This is a term for any new DNA sequencing technology post Sanger Sequencing.
NGS takes a DNA sample and fragment it in to small pieces. The two strands are separated, and a controlled chemical reaction occurs to add the complementary DNA bases back, one at a time, to the single strand to create a double strand. A chemical or fluorescent signal is given off as each base is added. These signals effectively “read out loud” the sequence of the DNA therefor
“Short read” technologies. mean that only short fragments (typically <600bp) of DNA can be read. So to sequence a larger piece of DNA you read lots of short fragments and then the sequences are “Stitched back together” by computer afterwards to create the complete sequence.
However, to ensure accuracy these technologies repeat the sequencing of each fragment many, many times over to make sure the same result is achieved each time. This happens simultaneously in the NGS instrument with many parallel reactions occurring at the same time. The results from each parallel reaction are compared by computer and statistics are used to eliminate any errors or spurious results.
What are the advantages of NGS vs Sanger sequencing?
The “massively parallel” nature of NGS is the big advantage of the technology. This means millions of sequencing reactions can occur at the same time on the same instrument. This has dramatically increased the speed and reduced the cost of DNA sequencing vs the older Sanger technology.
So where as it took 10 years and £100m to sequence the first human genome, NGS makes it possible today to sequence a whole human genome in a day for less than £1000
The major category of interest now is the “long read” technologies. For example, PacBio and Oxford Nanopore have the ability to read thousands of bases in a single continuous read. Initially these technologies produced data with a much higher error rate than the short reader technologies but this has been improved. I will discuss Oxford Nanopere sequencing in more detail
Regardless of the Technology the DNA must be prepared for sequencing.
The workflow of Illumina NGS
https://www.cd-genomics.com/blog/principle-and-workflow-of-illumina-next-generation-sequencing/
Step 1. Library preparation
Through ultrasonic fragmentation, the genomic DNA becomes DNA fragment with 200-500bp in length. The 5’ and 3’ adapter are added to the two ends of these small segments, “tagmentation” combines the fragmentation and ligation reactions into single step that greatly increases the efficiency of the library preparation process. Adapter-ligated fragments are then PCR amplified and gel purified. The sequencing library is constructed.
http://wp-content/uploads/sites/2/2018/10/library-preparation.jpg

Figure 1. The 1st step: library preparation
Step 2. Cluster generation
Flow cell is a channel for adsorbing mobile DNA fragments, and it’s also a core sequencing reactor vessel — all the sequencing happens here. The DNA fragments in the sequencing library will randomly attach to the lanes on the surface of the flow cell when they pass through it. Each flow cell has 8 Lanes, each lane has a number of adapters attached to the surface, which can match the adapters added at the ends of the DNA fragment in the building process, which is why flow cell can adsorb the DNA after the building, and can support the amplification of the bridge PCR on the surface of the DNA. In theory, there is no mutual influence between these lanes.
Bridge PCR was performed using the adapters on flow cell surface as template, after continuous amplification and mutation cycles, each DNA fragment will eventually be clustered in bundles at their respective locations, each containing many copies of a single DNA template.
The purpose of this process is to amplify the signal intensity of the base to meet the signal requirements for sequencing. When cluster generation is complete, those templates are ready for sequencing.

Figure 2. The 2nd step: cluster generation
Step 3. Sequencing
The sequencing method is based on sequencing-by-synthesis (SBS). DNA polymerase, connector primers and 4 dNTP with base-specific fluorescent markers were added to the reaction system. The 3′-OH of these dNTP are protected by chemical methods, which ensures that only one base will be added at a time during the sequencing process. All unused free dNTP and DNA polymerase are eluted after the synthesis reaction finished.
Then, buffer solution needed for fluorescence excitation are added, the fluorescence signal is excited by laser, and fluorescence signal is recorded by optical equipment.
Finally, the optical signal is converted into sequencing base by computer analysis. When the fluorescence signal is recorded, a chemical reagent is added to quench the fluorescence signal and remove the dNTP 3′-OH protective group, so that the next round of sequencing reaction can be performed.

Figure 3. The 3rd step: sequencing
Step 4. Alignment & Data analysis
The newly identified sequence reads are aligned to a reference genome, then many variations of bioinformatics analysis are possible such as SNP/InDel/SV/CNV calling, annotation and statistics, pathway enrichment analysis, population genetics analysis and more.

Figure 4. The 4th step: alignment and data analysis.
The above is Illumina NGS chemistry overview, the SBS technology allows single-end and two-end sequencing, improves the ability to fully identify any genome.
But what about RNA? You have to concert it to cDNA like with RT-PCR
Once you have obtained your RNA sample for analysis, the first step in the technique involves converting the population of RNA to be sequenced into complimentary DNA (cDNA) fragments (a cDNA library). This is done by reverse transcription and allows the RNA to be put into an NGS workflow.
The cDNA is then fragmented, and adapters are added to each end of the fragments. These adapters contain functional elements which permit sequencing, for example, the amplification element (which facilitates clonal amplification of the fragments) and the primary sequencing priming site. Following processes of amplification, size selection, clean-up and quality checking, the cDNA library is then analyzed by NGS, producing short sequences that correspond to all or part of the fragment from which it was derived
Single-read sequencing is a cheaper and faster technique (for reference, about 1% of the cost of Sanger sequencing) that sequences the cDNA fragments from just one end. Paired-end methods sequence from both ends and are therefore more expensive but offer advantages in post-sequencing data reconstruction.
These reads, of which there will be many millions by the end of the workflow, can then be aligned to a reference genome if available or assembled de novo to produce an RNA sequence map
To preparing the cDNA library. requires fragmentation of the cDNA, addition of the platform-specific “adapter sequences” and amplification of the cDNA, but the exact procedure will be very specific to the platform used at this stage.
For strand-specific protocols, the amplification of the cDNA involves a reverse transcriptase-mediated first strand synthesis followed by a DNA polymerase-mediated second strand synthesis.
Barcodes may also be added that enable multiplexing, so numerous samples can be sequenced in a single run.
cDNA sequencing
Once the library is prepared, you can use your chosen sequencing platform to sequence your cDNA library. You can map the data to your reference genome or assemble it de novo if no reference is available.
Sars-Cov-2 Whole Genome Sequencing

https://www.ncbi.nlm.nih.gov/pmc/articles/PMC8294598/#!po=0.378788
The whole-genome sequencing (WGS) of SARS-CoV-2 has been used as a powerful tool to study COVID-19 since the first sequence was released on January 10, 2020 (Wu et al., 2020).
To uncover the complete or near-complete sequence of SARS-CoV-2, leading laboratories have used several sequencing protocols, including shotgun metagenomic approaches (Bedford et al., 2020; Butler et al., 2020), target-capture sequencing using Twist custom target enrichment (Maurano et al., 2020), and target whole-genome amplification sequencing by a multiplex ARTIC primer set (Long et al., 2020; Lu et al., 2020a).
Notably, SARS-CoV-2 WGS requires a viral RNA isolation from the clinical samples for sequencing library construction, and there can be orders-of-magnitude differences in viral load across different subjects. A large proportion of clinical samples contain extremely low viral copy number, which may impact the quality of WGS and the confidence in calls of SNV or indel detection. This is why CDC instructs hospitals to only send samples for sequencing if Ct is 28 or less
Third Generation Sequencing (TGS)
Third generation sequencing platforms move away from the amplification process used in older short read next generation sequencing platforms.
Oxford Nanopore is one of the industry leading companies that commercialized the technology. The MiniION by Oxford Nanopore Technologies, allows sequencing on a desktop computer via a USB device.
The DNA is passed through a protein nanopore membrane and sequencing detection is determined by the creation of an ionic current that changes based on the nucleotide.
Traditional methods are only able to sequence short lengths of DNA which must then be reassembled. It is therefore difficult to sequence repetitive regions for accurate genome assemblies without gaps, resolve large structural variations, or differentiate isoforms. Nanopore sequencing is limited only by the length of the DNA/RNA fragment presented to the pore and can therefore span entire repetitive regions, resolve structural variants, and differentiate between different isoforms. The ability to sequence native DNA and RNA without the requirement for amplification, eliminates PCR bias and allows for the identification of base modifications, such as methylation, alongside nucleotide sequence.
Oxford Nanopore’s strategy is to pass a single-stranded DNA molecule through a tiny pore in a membrane.
The pore is formed by a proprietary protein called a nanopore . The identity of the protein nanopore used in the Oxford Nanopore system is proprietary information, but it is likely to be a protein similar to alpha-hemolysin.
Alpha-hemolysin is a 7-polypeptide protein membrane pore complex produced by the pathogenic bacterium Staphylococcus aureus. Its normal function is to form pores in the cell membrane of host cells, causing lysis of those cells.
If a current is applied across a membrane containing alpha hemolysin, single-stranded DNA will move through the alpha hemolysin pore on its own, due to its negative charge as shown in this computer simulation:
http://www.ks.uiuc.edu/Research/hemolysin/translocationDNA.mpg
In the Oxford Nanopore system, in addition to a nanopore protein, a second helicase-like motor protein (its identity is also proprietary) unwinds double-stranded DNA and passes a single-strand of DNA one nucleotide at a time through the nanopore.
The DNA disrupts the current across the membrane in a sequence-specific manner since each nucleotide has a unique size, shape, and distribution of charge.
Thus, the change in current can be interpreted as a nucleotide sequence. This technology was under development for the past two decades and has recently been commercially released.
It has many advantages, including the fact that it does not require a PCR amplification of template DNA (PCR can introduce mutations), it generates digital sequence data so it doesn’t generate memory-intensive image files, and it has the ability to sequence extremely long DNA fragments, up to hundreds of thousands of base pairs in one molecule.
In addition, since each nanopore can sequence only one DNA molecule at a time (but can sequence additional DNA molecules after finishing the first), there is no need to separate template DNA fragments into separate wells and so less sample preparation is needed than with other methods. Nanopore currently has a goal of further reducing the cost of human genome sequencing to $800.
Genomic epidemiology is the study of how variations in the genomes of pathogens, or their hosts, influence health and disease, including how common specific variations are, how they interact with environmental factors, and how they contribute to disease risk.
Scientists around the world are using nanopore sequencing to rapidly sequence and analyse SARS-CoV-2 virus genomes. In combination with rapid data sharing across the scientific community, this enables genomic epidemiological analysis, which has become a key part of the global public health response to the COVID-19 pandemic.
By rapidly sequencing and sharing SARS-CoV-2 genomic data, it is possible to:
Quickly identify variants and track their prevalence and distribution. These may impact the nature of the disease caused by the virus, or inform future treatment strategies and vaccine design.
Determine how strains of the virus are related. This can help indicate, or rule out, routes of transmission, enable identification and investigation of clusters, and help inform strategies to control the spread of the virus.
Arctic Protocol adopted for Sars-Cov-2 Whole Genome Sequencing
https://www.biorxiv.org/content/10.1101/2020.09.04.283077v1.full
The initial release of the ARTIC SARS-CoV-2 sequencing protocol was released early in the outbreak (Jan 22, 2020) supporting early sequencing efforts in many counties
Although SARS-CoV-2 genome sequencing using amplicon sequencing is cost-effective compared to other methods our LoCost protocol further reduced material cost to at or below a £10 per sample.
On 5th February, 2020 the first nCoV-2019 genome was released, sequenced using methods developed by the ARTIC network for rapid characterisation of the virus. The ARTIC network, funded by a Collaborative Award by the Wellcome Trust, has developed a set of lab and bioinformatics protocols for nCoV-2019 that enable characterisation of the virus on nanopore sequencers within 8 hours.
Scientists from Hangzhou CDC in China first used the methods developed by ARTIC to generate a high accuracy nCoV genome. The ARTIC method has been adopted by other labs in China, and has also been used in labs across four continents .
Dr. Jun Li; Hangzhou Centre for Disease and Control, said: “Hangzhou CDC took the lead in completing the nation's first 2019-nCov genome assembly using only nanopore data. No other technology is required to correct the data. The final assembly result is 100% consistent with the reference genome.
With the continuous development of the epidemic, it is possible to carry out accurate real-time monitoring of virus mutations in close proximity to samples and obtain effective information in a short period of time. It is particularly important to understand the development and spread of the epidemic, guide prevention and control work, and vaccine research.''
Professor Nicholas Loman; University of Birmingham and ARTIC principal investigator, said “This work has been built off our experience in developing rapid in-field sequencing solutions for viral epidemics. By producing viral sequences quickly and sharing this data on an open source platform, it is possible to maximise the utility of genomics data as a component of epidemic response”
This first ARTIC-generated genome is now publicly available on GISAID, for use in international efforts to understand the epidemiology of the outbreak. The workflow package developed by ARTIC includes a targeted multiplex primer scheme, real-time analysis using the RAMPART software package, and full step-by-step instructions: from sample to genome sequence ready for sharing with the international community.
The rapid provision of an optimised nCoV sequencing protocol was possible because of the experience of the ARTIC group in previous outbreak situations, including the West African Ebola virus epidemic of 2013-2016. For the past three years, the ARTIC project has been developing an end-to-end system for processing samples from viral outbreaks to generate real-time epidemiological information that is interpretable and actionable by public health bodies.
The team, made up of scientists from the universities of Edinburgh, Birmingham, Cambridge, Oxford, KU Leuven, UCLA and the Fred Hutchinson Cancer Centre, has previously developed methods, delivered ‘lab in a suitcase’ sequencing resources/solutions and collaborative local training in multiple outbreaks including Ebola, Zika virus and Yellow Fever. They are currently involved in projects that work with local scientists to provide support to the ongoing Ebola outbreak in DRC, polio virus surveillance in Pakistan and measles surveillance in Rwanda.
ARTIC has collaborated with Oxford Nanopore, whose sequencing technology delivers data in real-time, contributing to the rapid 8 hour end to end workflow.
In January, 2020 Oxford Nanopore noted that it had sent 200 of their portable MinION devices to China, to enable the rapid, local sequencing of nCoV in a broad network of public health laboratories.
Anyways, thats all I got. If people still want to believe viruses are an elaborate hoax so be it. Perhaps it would be possible if they were only recently discovered but this has been accepted for 100 years and we have many more tools which only confirm their existence
This does not mean exosomes dont exist or that exosomes cant carry RNA, viruses or toxic proteins like spike. Scientists have confirmed all of that. Exosomes have been shown to carry viruses, mRNA and spike protein (from vaccine) for example. It doesn’t prove viruses don’t exist